Monitor Amazon EC2 Linux Instance
Most monitoring metrics are provided by default by AWS CloudWatch. It does not, however, include any metrics for memory consumption or disc space usage. So, if you want to use CloudWatch to monitor your system’s System memory or free disc space. Then you first need to add these metrics with custom scripts to your account.
This tutorial will show you how to use AWS CloudWatch to monitor EC2 Linux instance memory and disc metrics. Keep in mind that this will not function on any Linux machine outside of the Amazon EC2 network.
Requirements
The Perl scripts provided by the AWS team will be used in this tutorial. These scripts are dependent on each other. You may install these dependencies using the instructions below, depending on your operating system.
RedHat Systems:
Debian Systems:
SUSE Linux Enterprise Server:
Script Configuration
CloudWatch monitoring scripts are provided by the AWS official team. You can simply download and configure the scripts on your machine. To download scripts and extract them on your machine, use the command below.
You now need to add your AWS account’s AWSAccessKeyId and AWSSecretKey. This will verify the script’s account ownership. You can generate keys in your account under Users >> Security credentials if you don’t have them.
Verify Connectivity
Your setup is complete at this point. To verify the script’s connection with your AWS account, use the following command.
On successful verification, the output will look like this.
Verification has been completed successfully. You may use crontab to schedule the script to send data to your ec2 account on a routine basis. Add the following command to crontab and execute it every 5 minutes.
READ MORE
2021’s Top Cloud Computing Trends
Check Metrics in CloudWatch
After adding crontab, you should wait for a little. As a result, it may collect data to display on a metrics graph. After some time has passed.
- Log in to AWS Dashboard
- Navigate to CloudWatch Services
- Select Browse Metrics.
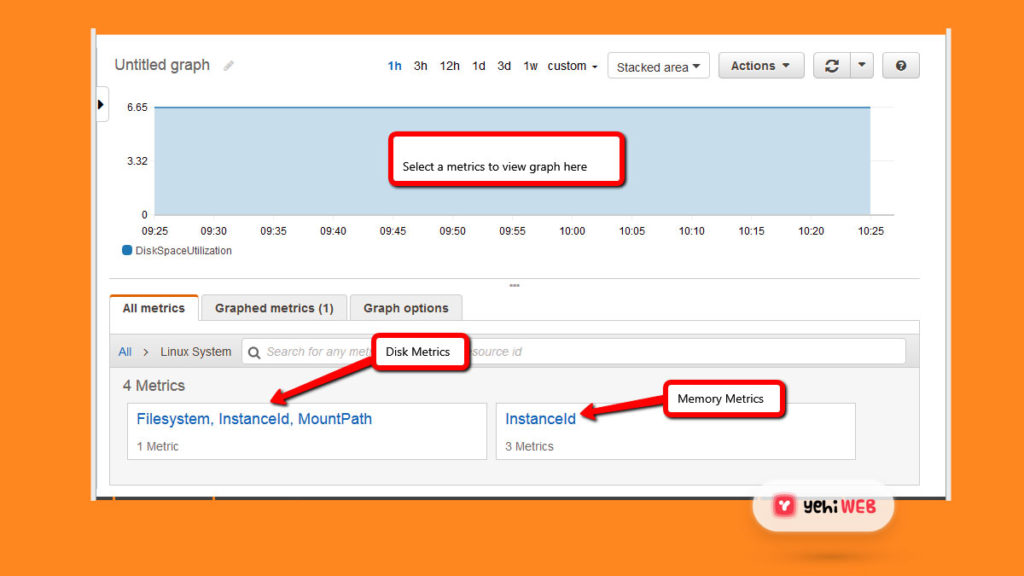
- Under Custom Namespaces, select Linux System.
Now, as seen in the picture below, select any statistic to display data in Graph.

Command-Line for Getting a Utilization Report
You can also see the data for the last 24 hours of resource usage. To acquire further information, type the following command.
The following is an example of the output:
Saad Shafqat
Related posts
New Articles
Top 4 VPS Hosting Services for Developers Building Scalable Web Apps
Choosing the right Virtual Private Server (VPS) hosting provider can significantly influence how efficiently developers build, deploy, and scale modern…


