


Use YouTube Analytics as the source of truth for performance reporting, and use vidIQ as the research layer that explains what to fix next. If your report needs accurate watch time, retention, revenue, traffic sources, and audience behavior, YouTube Analytics wins. If your report needs keyword gaps, competitor context, title ideas, and SEO scores, vidIQ adds useful color.
TLDR: A strong YouTube performance report template should pull core metrics from YouTube Analytics and add vidIQ insights for search and competitive analysis. For example, if a channel gained 18,400 views in 30 days but average view duration dropped by 22%, YouTube Analytics shows the problem, while vidIQ may show that the title is attracting the wrong search intent. A small education channel could use this combo to spot that “Photoshop tutorial” brings clicks, while “Photoshop masking tutorial for beginners” brings better watch time. That difference matters.
Why Your YouTube Report Template Should Not Rely on One Tool
A clean YouTube analytics report should answer three questions fast:
- What happened? Views, watch time, subscribers, revenue, impressions, and click-through rate.
- Why did it happen? Traffic sources, audience retention, search terms, suggested videos, and viewer behavior.
- What should we do next? Fix thumbnails, rewrite titles, target better keywords, or change video structure.
YouTube Analytics is excellent for the first two questions. It uses first-party channel data, so the numbers are the most reliable you can get. vidIQ is better for the third question, especially when you need SEO ideas, topic scoring, and competitor comparisons.
The catch is that both tools can feel incomplete on their own. YouTube Analytics gives deep data, but its interface can make simple comparisons feel oddly clunky. vidIQ gives quick suggestions, but some scores feel more like helpful signals than hard business metrics.
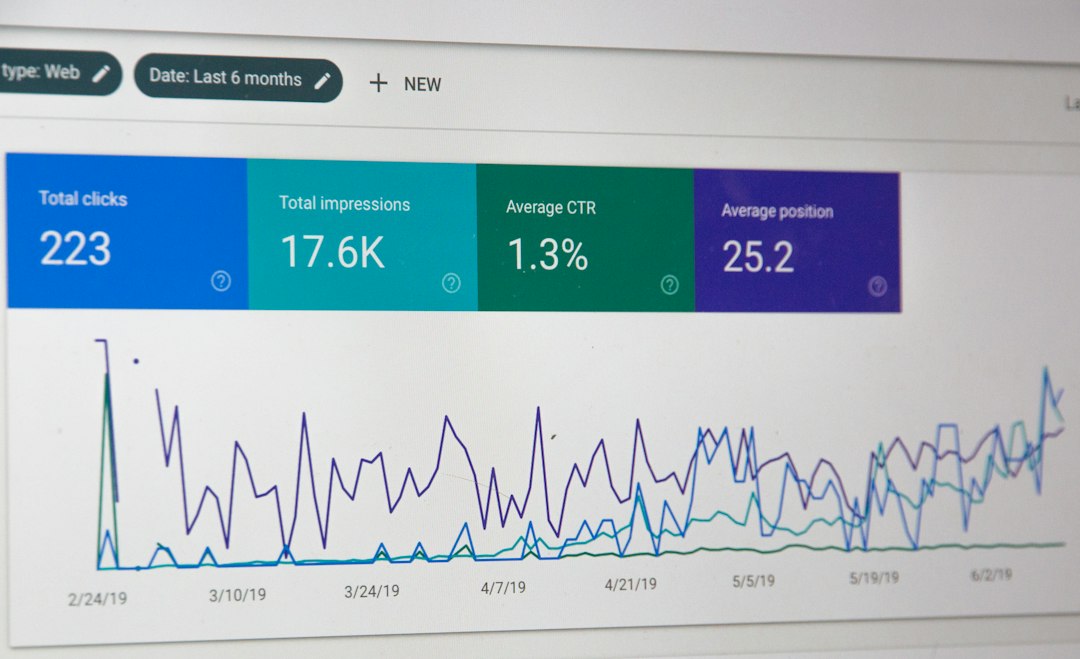
What to Include in a YouTube Analytics Report Template
A useful template should be easy to scan. Nobody wants a 20-page report full of charts that say the same thing in different colors. Keep the report focused on decisions.
Here is a practical report structure:
- Executive snapshot: Views, watch time, subscribers gained, revenue, top video, and biggest issue.
- Content performance: Best and worst videos by views, retention, CTR, and engagement.
- Traffic source breakdown: YouTube Search, Suggested Videos, Browse Features, External, Shorts feed.
- Audience retention: Average view duration, intro drop-off, key replay moments, end screen performance.
- Search and keyword section: Top search terms, ranking opportunities, vidIQ keyword scores.
- Competitor or benchmark section: Similar video topics, publishing frequency, view velocity.
- Action list: Three to five fixes for the next week or month.
This format works for creators, agencies, marketers, and internal content teams. It keeps the report useful instead of decorative.
Where YouTube Analytics Is Stronger
YouTube Analytics should sit at the center of your template. It tells you what viewers actually did on your channel. That includes the metrics YouTube itself uses to judge viewer satisfaction.
The most useful YouTube Analytics sections are:
- Reach: Impressions, click-through rate, traffic sources, and unique viewers.
- Engagement: Watch time, average view duration, retention, and end screen clicks.
- Audience: Returning viewers, new viewers, age, geography, and active times.
- Revenue: RPM, CPM, ad revenue, memberships, and transaction data.
- Advanced mode: Custom comparisons by video, date, source, geography, or device.
For reporting, the Advanced mode is especially useful. You can compare the last 28 days against the previous 28 days, track a campaign period, or isolate one playlist. That makes it easier to explain cause and effect.
For example, a video may have a 9.1% CTR, which looks great. But if the average view duration is only 48 seconds on an 8-minute video, the report should flag a mismatch. The thumbnail gets clicks, but the intro fails to hold attention. YouTube Analytics makes that obvious.
Where vidIQ Is Stronger
vidIQ is best when your report needs context beyond your own channel. It helps answer questions like, “What keywords should we target?” and “Why is a competing video getting more views?”
Useful vidIQ report elements include:
- Keyword scores: Search volume, competition, and opportunity estimates.
- Competitor tracking: Upload frequency, top videos, and channel growth signals.
- SEO checks: Title, tags, description, and optimization tips.
- Trend alerts: Related topics gaining attention.
- Daily ideas: Content prompts based on your niche.
Honestly, it feels like vidIQ is most helpful before and after publishing, not during deep performance review. Before publishing, it can shape the title, topic, and keyword angle. After publishing, it can help explain whether weak search traffic came from poor keyword fit or a crowded topic.
vidIQ vs YouTube Analytics: Report Template Comparison
Here is how the two tools fit into a YouTube performance report:
- Views and watch time: Use YouTube Analytics. vidIQ may show summary figures, but YouTube is the trusted source.
- Audience retention: Use YouTube Analytics. vidIQ cannot replace the retention graph.
- Revenue reporting: Use YouTube Analytics. vidIQ is not the place for RPM or ad revenue analysis.
- Keyword planning: Use vidIQ. YouTube Analytics shows search terms after they bring traffic, not always before.
- Competitor review: Use vidIQ. YouTube Analytics does not give direct competitor dashboards.
- Thumbnail and title decisions: Use both. YouTube shows CTR and retention. vidIQ helps with keyword and title ideas.
A smart template gives each tool a clear job. That removes confusion and keeps the report honest.
Sample Monthly Report Layout
For a monthly YouTube performance report, use a simple flow:
- Channel summary: “Views rose 14%, watch time fell 6%, and subscribers increased by 310.”
- Top wins: List the three videos with the best watch time or subscriber growth.
- Top problems: List videos with high impressions but low CTR, or high CTR but poor retention.
- Search insights: Add vidIQ keyword notes and YouTube search terms.
- Competitor notes: Mention two competing videos that gained traction and why.
- Next actions: Set specific tasks, such as “Rewrite titles for five low-CTR videos.”
Do not bury the action items. Put them near the front or right after the summary. Reports are often read quickly, sometimes five minutes before a meeting. Make the useful part impossible to miss.
Example Use Case: Small SaaS Channel
Imagine a SaaS company posts weekly tutorial videos. In March, the channel gets 42,000 views, up from 35,000 in February. Sounds good. But YouTube Analytics shows watch time only grew by 3%, while views grew by 20%. That means more people clicked, but many did not stay.
The retention graph shows a sharp drop in the first 25 seconds. The intros are too slow. vidIQ then shows that the channel ranks for broad terms like “CRM setup,” but competitors rank for more specific terms like “CRM setup for real estate agents.”
The report recommendation would be clear: shorten intros, target narrower keywords, and create industry-specific tutorials. That is a much better takeaway than “views went up.”

Common Reporting Mistakes
Creators often track too many numbers and miss the story. A high view count can hide weak retention. A strong CTR can hide bad targeting. A jump in subscribers can come from one viral Short that does nothing for long-form sales videos.
Another mistake is treating vidIQ scores as final truth. They are useful indicators, not guarantees. A keyword with a strong score still needs a good video, a clear promise, and a thumbnail that fits the audience.
Expect to waste time if you export everything without filtering. YouTube gives you a lot of data. vidIQ gives you a lot of suggestions. Your report template should cut the noise.
Best Choice for YouTube Performance Reports
For reporting accuracy, choose YouTube Analytics. For planning and improvement ideas, add vidIQ. The best YouTube analytics report template uses both, but not equally.
Use YouTube Analytics for the official performance record. Use vidIQ for SEO, competition, and content planning. That mix gives you a report that is accurate, readable, and useful for the next upload.
If you need one simple rule, use this: YouTube Analytics tells you what happened; vidIQ helps you decide what to try next.



Session Definition: What Is a Session in Computing?
A session in computing is a temporary interaction between a user, device, application, or server that starts at one point…